Product analytics software is a robust right hand that provides businesses with a clearer way to understand how customers interact with their digital products. Generally, you can use data from product analytics tools to enhance customer experience, make sure your roadmap aligns with customers’ requirements, boost conversion, and improve engagement!
Here’re some important features and integrations of product analytics software to help you achieve in-depth data and make a product-led growth strategy.
Key Features of Product Analytics Tools to Consider
1. Custom event tracking
A custom event is generated from one or more user interactions, optionally filtered down by a specific set of attributes, and given a name. It is useful for:
- Merging two related events into a single event, i.e. combining “User Signup” and “Account Created” into “Signup.”
- creating a new event based on a filter on an existing one. i.e. “Purchase where Country = “US” can be “US Purchases.”
This feature enables you to supercharge product analytics by customising it to your business’s specific requirements. From this analysis, you can better understand customer behaviour and use it in other reports.
2. Time period / Seasonal comparison
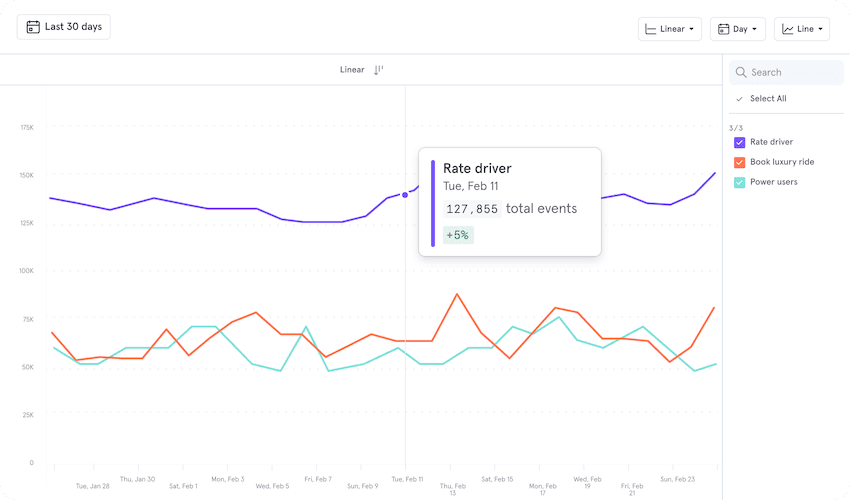
To more clearly observe how trends have changed over time, it’s worth considering product analytics tools that have features allowing you to compare time ranges or between seasons– such as this quarter to the previous quarter or this spring compared to the previous spring.
Comparing historical periods allow you to track:
- How DAU/ MAU/ conversion rate/ number of users/… has altered across time
- Which factors have contributed to the changes
- Whether there are any significant differences that you need to note down
With the period-over-period comparison, you can gather the information that matters. Identify trends or problems and then act on those insights.
3. Analytic dashboard
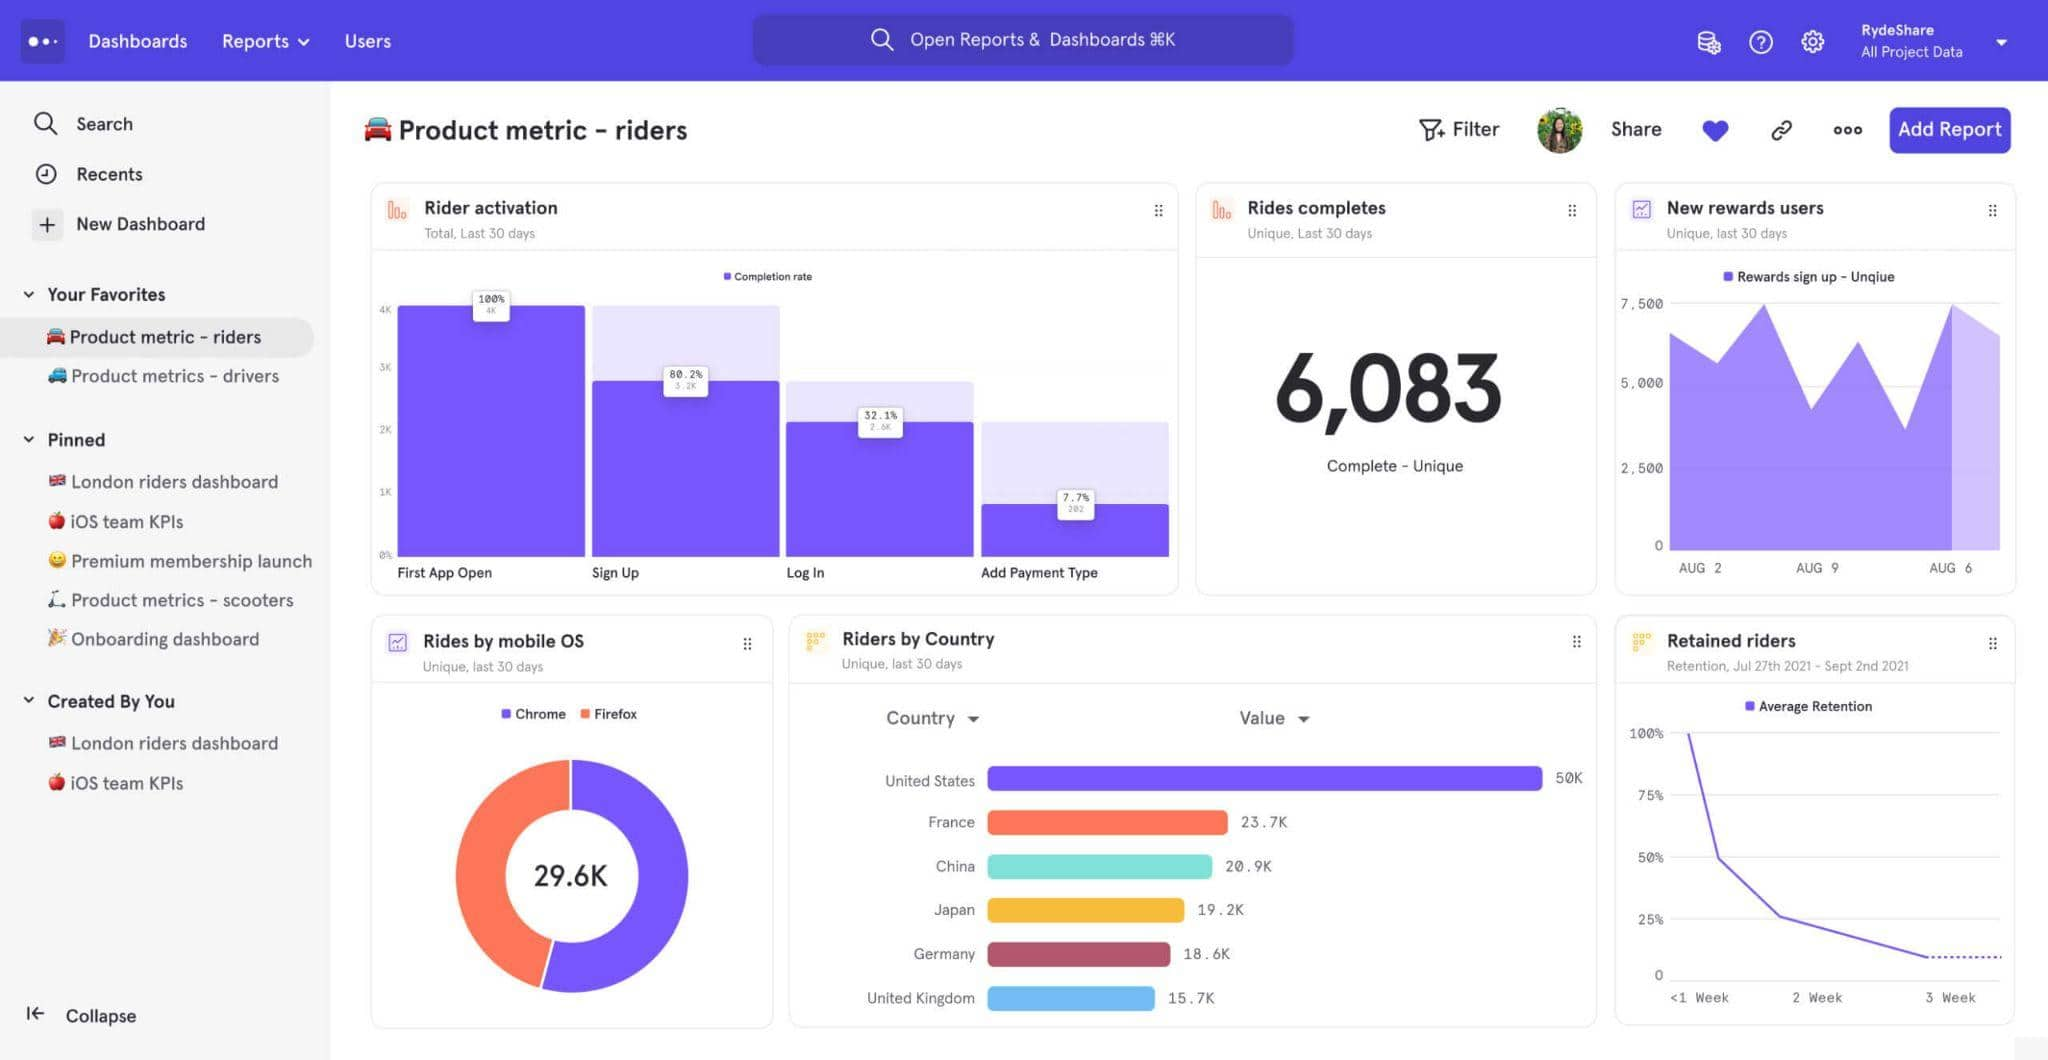
Dashboards are necessary for all team members to conveniently track and analyse product metrics in one place. Moreover, they also act as a homepage for your report, where all the most essential information is aggregated.
Some benefits of dashboards include:
- Accessibility and easiness of sharing insights with others
- Real-time updated insights for the most up-to-date view of data
- A high-level overview of the information that’s simple to digest
- From the dashboard, you can go directly to a report for more details
Depending on your role, you may need to monitor several dashboards and make use of them in different scenarios. Here are some vital analytics dashboards for your business’ common use:
- Marketing dashboard: Evaluate the performance of marketing activities through reports on traffic, sign-ups and sales.
- Uptime dashboard: Gauge the percentage over time to see how close you are to 100% uptime and when downtime is most likely to happen.
- Product dashboard: You can track product usage KPIs such as WAU/MAU and engagement rate to help direct development.
- Growth dashboard: This feature will track all factors related to your business growth, like revenue, traffic, accounts, etc.
- Traffic dashboard: Sitewide traffic, as well as visitor data for a crucial web page, can be evaluated on the traffic dashboard.
- Spend dashboard: Help you answer questions related to budget, such as Does a marketing campaign have good ROI? How much is customer acquisition? How much does it cost to turn a lead into a real customer?
- Revenue dashboard: All corporations want to figure out how much money they are earning and how to boost profit. Data like sales and retention reports can provide you with an accurate answer.

4. Conversions and time-to-convert funnel analysis
A conversion funnel detects the steps active users take to convert during the designated timeframe. The analysis is essential for lowering friction on your website since it reveals where customers get stuck or drop off. Thus, you can know how conversion rates vary by segment and uncover hidden conversion trends.
Additionally, with the time-to-convert chart, you can determine how many minutes, hours, or days it takes users to complete a given Funnel step. From that, identify the steps that are taking users longer than necessary to complete, for instance, the checkout process, and send them a reminder to nudge them along.
5. Retention reporting
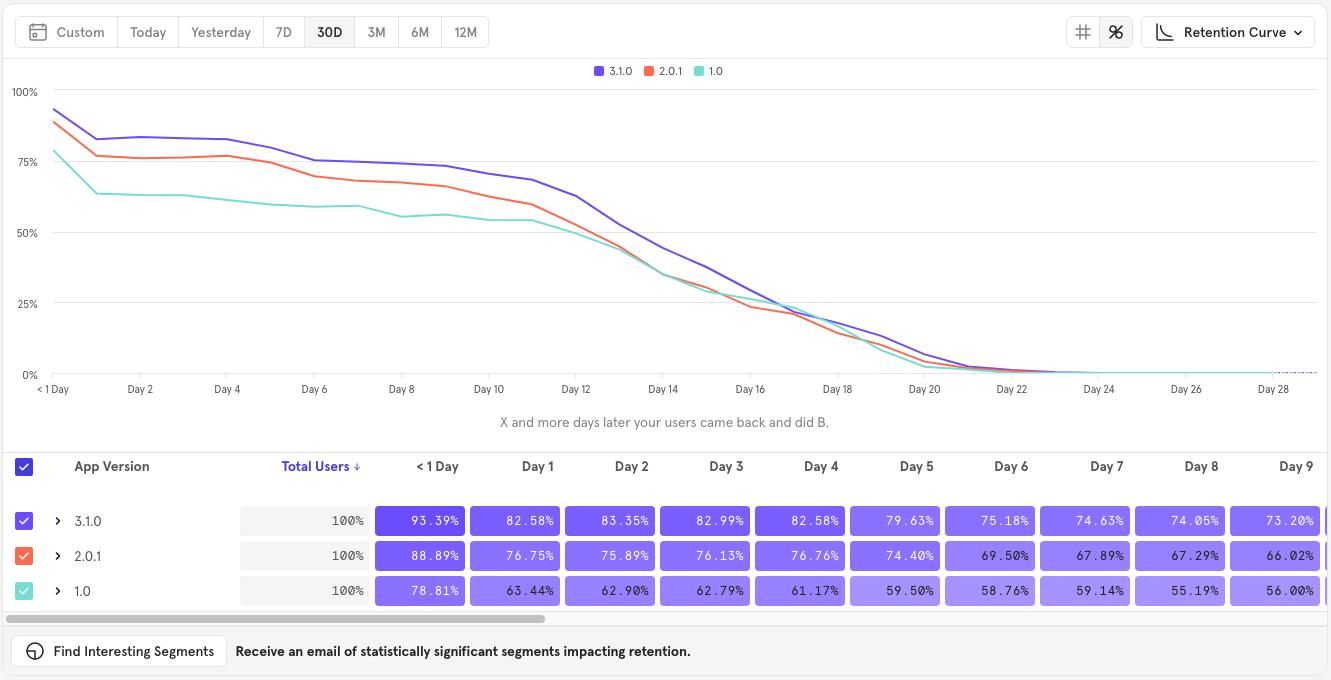
Retention evaluates how long users continue to come back and find value in your product. Your customer retention is vital in achieving product-market fit and sustainable long-term growth.
This feature also offers a Retention Trend Visualisation for observing any modifications in a certain retention bucket over time. With retention reporting, you can specify the user actions that most accurately predict retention and design the workflows that lead users to those actions.
Besides, you can also calculate the lifetime value (LTV) of users by taking into account factors such as customer acquisition cost, customer lifetime, and average order value to determine the total revenue a customer will generate for the company. The LTV metric is used in retention reporting to measure the success of customer retention efforts and to help companies make informed decisions about future investments in customer acquisition and retention.

6. Segment analysis
Segment analysis functionality enables you to group customers based on shared attributes, cohorts or actions so that you can spot actionable differences between those groups. This feature is particularly valuable for visualising differences in cohort behaviours and analysing how these distinctions influence engagement, conversion, and retention – quickly and simply.
Besides, there are also other reports that can be used for Product Analytics, such as cohort analysis, trend analysis, experiment analysis and more.
7. A/B testing (Split testing)
When developing products, testing different variations help you identify the most preferred or the most high-performing version. It helps optimise your app performance, reveal user behaviours and hidden trends, and incorporate their feedback.
By testing and optimising each user journey’s stage, you can accelerate the user process while understanding more about what they actual need. Additionally, as the majority of the tests take place without the user’s active knowledge, this feature is non-invasive and doesn’t interfere with their experience.
Crucial Product Analytics Tools Integrations
As product analytics tools are used effectively for determining customer journeys, integrations with third-party tools are important for taking further action on that information. Integrating your existing tools with product analytics systems will assist in sharing the data for marketing, sales, customer support and product development activities.
Read more: 3rd Party API Integration: Ultimate Guide For Your Banking Software
When evaluating the appropriate tool, it’s worth noting that the tool you need will work effectively with the following systems:
1. Customer relationship management software (CRMs)
To track the interactions between your business and customers, CRM is a bridge. The most benefit of integrating your existing CRM with a product analytics tool is sharing up-to-date account health data.
Traditionally, monthly check-ins or support tickets are used to gauge account health. However, product analytics solutions can track in real-time the number of users in a given account is using and what are their actions. These insights then help the Customer Success team make better decisions on accounts that require more attention, which accounts are ready for upsell, and which accounts seem poised to churn.
2. Attribution platforms
Since this software enables you to quantify the value of your marketing efforts, integrating it with a product analytics tool will provide you with more granular, downstream insights.
For instance, rather than just observing an audience download a whitepaper and subsequently convert, you can analyse what a consumer clicked on across the site and if they are still engaging six months later.
3. Composable Customer Data Platform (CDP)
A CDP software is used to centralise data from various customer interactions. By integrating the product analytics tool with CDP, you can ensure that accurate data is sent to the right part of your organisation.
Mixpanel can help you ingest product instrumentation data sourced from their SDK or from a CDP and place it in their compute silos for further analytics.
4. Data pipelines and Data warehouse
To bring data into a data warehouse, you’ll need data pipelines. While some tools require you to build these pipelines manually, advanced tools such as Mixpanel or Heap have offered pre-built pipelines and managed ETLs to help you clean and transform data effortlessly. If your business has already used a data warehouse, a product analytics tool with this functionality can be worthwhile to invest in.
Besides, as your company grows, it’s necessary to integrate with a data warehouse to host and analyse a vast amount of information, such as marketing data, human resources data, inventory data, and more. Therefore, when choosing product analytics tools, you should consider systems that support export data to common destinations like Snowflake, Google BigQuery, and Amazon Redshift Spectrum.
5. Engagement platforms
A customer engagement platform is software that detects, manages and facilitates interactions with your prospects and users. By integrating with the engagement platform, you can collect and act upon data from a product analytics tool to send personalised messages, emails, or notifications at the perfect moments. Thus, increasing the engagement with users at the high-converting points and improving customer experience.
So, Which Product Analytics Tools to Consider?
When choosing product analytics tools, there are some must-have features and integrations that you need to consider. Besides, it’s worth keeping in mind that each tool will have its own unique features and can work best for different target groups of users. To find out the best-suited one, you can start with the most commonly–used tools and the software that is highly recommended first.
With our experience in helping clients with their data analytics and choosing the right tool, we’ve prepared a list of top-picked 5 Product Analytics Tools that you should have tried! Besides, our experts also can help your company with customised solutions to optimise your digital products and improve customer experience.


