As the adoption of DevOps practices continues to grow among dedicated software development team, there is an ongoing discussion surrounding defining and measuring productivity for DevOps developers.
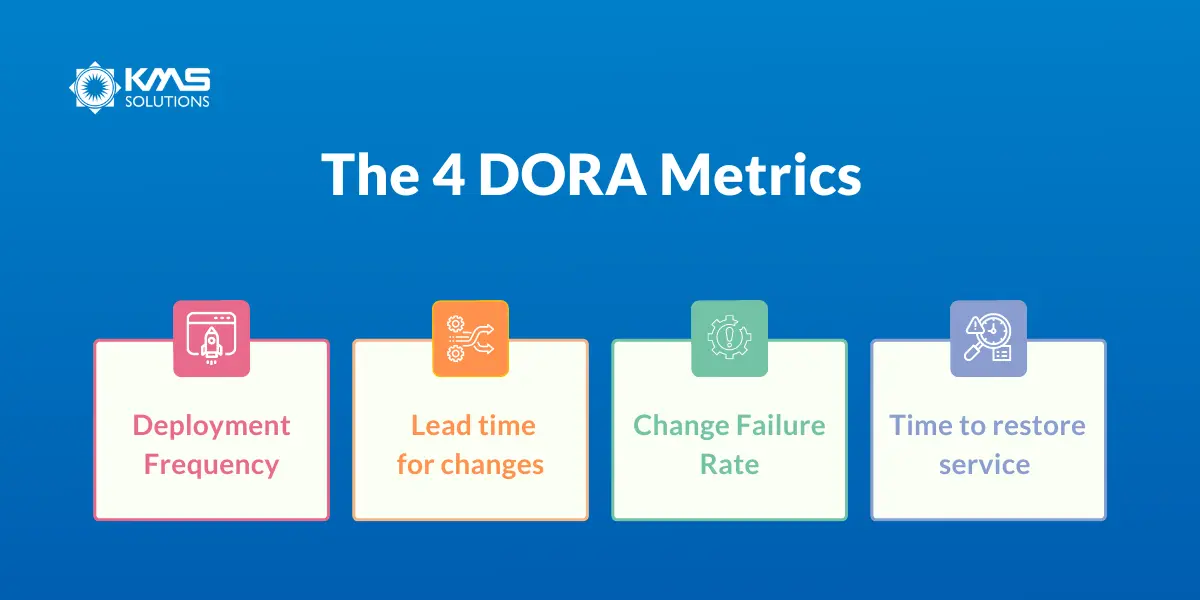
To address the concern, the DevOps Research and Assessment (DORA) group has conducted extensive research over six years and established the four key metrics, widely known as the DORA metrics, that serve as valuable indicators for measuring DevOps performance.
This article will delve into these four key DORA metrics, exploring their significance and what they can reveal about your DevOps team. By understanding and leveraging these metrics, you can gain valuable insights into your team’s performance and make informed decisions to drive continuous improvement within your DevOps practices.
The importance of DORA metrics for DevOps dedicated software development team
The DORA metrics play a vital role in DevOps by providing a standardized and objective framework for measuring performance. Prior to the establishment of these metrics, organizations and teams often relied on their own set of metrics, making it challenging to establish benchmarks, compare performance across teams, or track progress over time.
These metrics enable teams to assess their performance and take targeted actions to improve software delivery, ensuring faster and more reliable releases. For leaders in software development organizations, these metrics offer specific data to measure their organization’s DevOps performance and make informed decisions for process improvements.
The 4 crucial DORA metrics

The DORA framework encompasses four essential metrics divided into two core aspects of DevOps. The metrics used to measure DevOps speed are Deployment Frequency and Mean Lead Time of Changes. In contrast, stability is evaluated through Change Failure Rate and Mean Time to Recovery.
Based on their performance in these areas, companies are classified into different categories, including high performers, medium performers, or low performers.
1. Deployment frequency
This metric measures how often a business successfully releases production
In this context, deployment refers to moving a code snippet to production, encompassing the coding and testing phases.
To calculate deployment frequency, you can divide the total number of deployments made in a specific period (e.g., a month) by the number of days in that period. For instance, if a team deployed code 12 times in a month that had 30 days, the deployment frequency would be 12/30, resulting in an average of 0.4 deployments per day.
According to Google’s 2022 State of DevOps report, a high-performing software development team shall have multiple deploys daily.
| Software delivery performance metric | Low | Medium | High |
| For the primary application or service you work on, how often does your company deploy code to production or release it to end users? | Between once per month and once every 6 months | Between once per week and once per month | On-demand (multiple deploys per day) |
2. Lead time for changes
The metric measures the time it takes a commitment to get into production. It’s a valuable indicator of the development process efficiency, code complexity and team capacity.
A high lead time for changes suggests the presence of potential inefficiencies or bottlenecks within your team’s process. Conversely, a low lead time for changes signifies that your team can swiftly respond to feedback or adapt to changes.
The Lead Time to Changes rely on two crucial data elements: the timestamp of the commit and the timestamp of the deployment. To accurately calculate this metric, it is necessary to maintain a comprehensive record of all the changes included in each deployment. This can be achieved by utilizing triggers that associate a unique SHA (Secure Hash Algorithm) identifier to the commits. By joining this deploy table with the changes table, which contains timestamps, you can calculate the median lead time. An ideal change lead time would be between one day and one week.
| Lead time for changes | Low | Medium | High |
| For the primary application or service you work on, what is your lead time for changes (i.e., how long does it take to go from code committed to code successfully running in production) | Between 1 month and 6 months | Between 1 week and 1 month | Between 1 day and 1 week |
3. Change Failure Rate
The metric examines the percentage of deployments that result in failures during production. It is calculated by dividing the number of incidents by the number of deployments. These incidents may arise from various sources such as bugs, labels on GitHub incidents, a pipeline that feeds into spreadsheets, or an issue management system.
The optimal target for the change failure rate is between 0 and 15%. This range signifies a desirable level of success in implementing changes, reflecting a low incidence of failures or disruptions during the deployment process.
By closely monitoring and striving to keep the change failure rate within this desirable range, organizations can increase customer satisfaction and retention.
| Change failure rate | Low | Medium | High |
| For the primary application or service you work on, what percentage of changes to production or released to users result in degraded service (e.g., lead to service impairment or service outage) and subsequently require remediation (e.g., require a hotfix, rollback, fix forward, patch)? | 46% – 60% | 16% – 30% | 0% – 15% |
4. Time to restore service
The metric assesses the duration it takes for an organization to recover from a production failure. Measuring this metric requires information about when the incident was created and when you successfully resolved the incident. This data can be sourced from any incident management system that the organization utilizes. By analyzing the Time to Restore Services, organizations can gain insights into their ability to promptly address and rectify production failures, leading to improved service reliability and minimizing downtime.
| Time to restore service | Low | Medium | High |
| For the primary application or service you work on, how long does it generally take to restore service when a service incident or a defect that impacts users occurs (e.g., unplanned outage or service impairment)? | Between 1 week and 1 month | Between 1 day and 1 week | Less than 1 day |
Other essential metrics
Another metric that holds significance in the DevOps realm is cycle time. It measures the duration a team spends working on the product until it is ready for deployment. This metric plays a crucial role in providing project leads and engineering managers with insights into the effectiveness of their development pipeline. Furthermore, it enables project leads to establish a baseline for the development pipeline, which can be employed to evaluate and improve future processes. Teams that optimize cycle time often experience reduced work in progress and more efficient workflows.
Lean product management strongly emphasize on value stream mapping, which involves visualizing the entire flow from the conception of a product or feature to its final delivery. DevOps metrics offer valuable data points for effective value stream mapping and management, although they should be complemented with other business and product metrics for a comprehensive end-to-end evaluation. For instance, sprint burndown charts offer insights into the accuracy of estimation and planning processes, while the Net Promoter Score gauges customer satisfaction and whether the final deliverable meets their needs.
Wrap Up
Continuous improvement in DevOps relies on measuring and tracking key performance metrics like lead time for changes, change failure rate, deployment frequency, and MTTR. These metrics enable dedicated software development team to accelerate velocity, increase quality, and identify areas for improvement in their development processes.
If you’ve identified issues within your DevOps development team and are unsure of an effective way to enhance their performance, KMS Solutions is happy to lend a hand.
Whether you need guidance in building a robust DevOps toolchain, expert consultation on structuring your DevOps team, or establishing of an outsourced DevOps development team, we’ve the expertise to meet your needs.
Contact us today to embark on a successful DevOps transformation and drive your organization’s growth.


